The continuation vehicle (“CV”) market gradually matures, and newly expanded datasets now provide stronger empirical support for many of the early theses surrounding CV performance. Recent public reports indicate that CVs tend to exhibit lower return volatility and competitive vintage‑year performance against buyout funds, particularly among top‑quartile outcomes.
However, with much of the value still unrealized, questions remain around final results. Even so, market dynamics and forward‑looking estimates point to continued growth in the GP‑led segment, with 2026 expected to be a pivotal year for assessing the true performance profile of these structures.
As the market for continuation vehicle transactions evolves and more information is shared on this burgeoning segment of the secondaries market, we feel it’s prudent to revisit our past comments in “Why Are GP-led Secondaries an Asset-class Where you Need to Invest and You Cannot Live Without”, on the subject with the benefit of fresh insights and newly released data.
By in large, our general views on this market remain unchanged. The latest wave of public data appears to support the previous conclusions, now with the benefit of a more robust dataset. For several years, market participants have been promoting the performance attributes of CVs based more on thesis than proven and time-tested data. Now at this point of maturity of the CV market, there appears to be substantial support to justify that initial thesis.
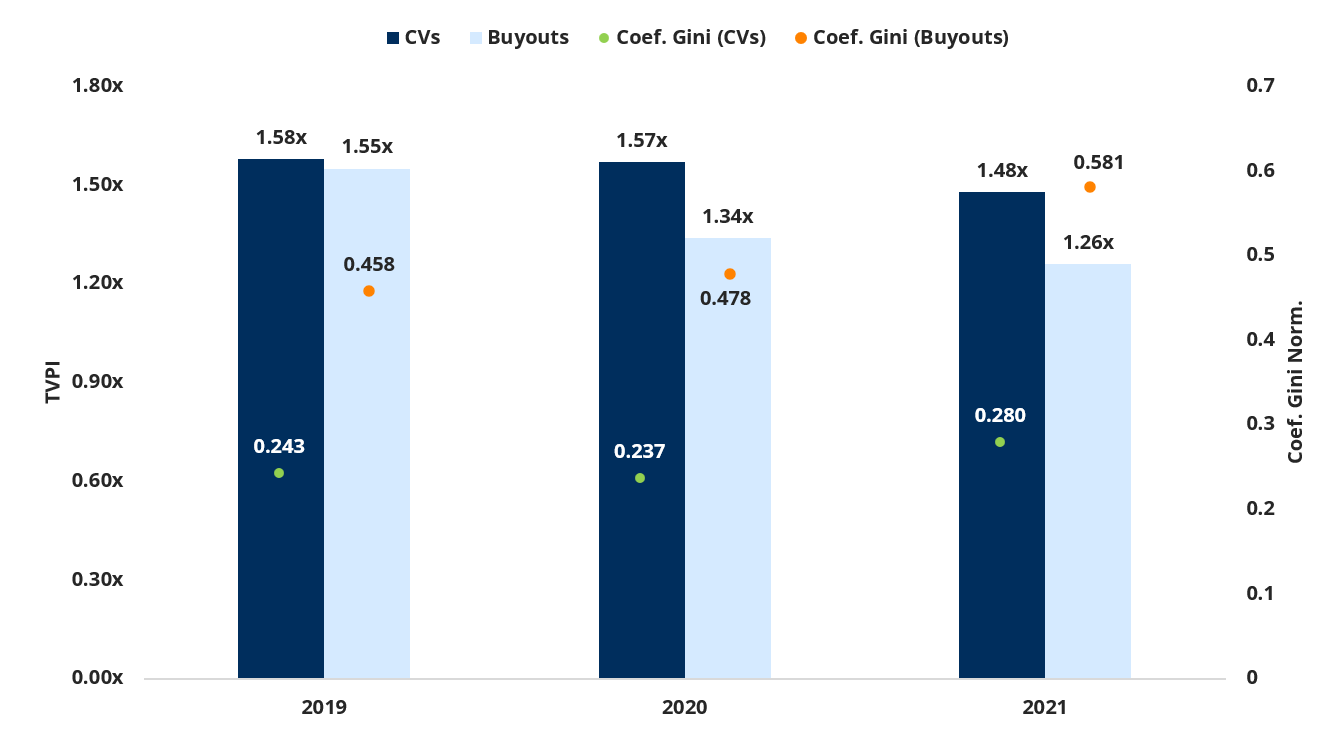
A fourth generation of performance data was released in a report in 2025 by Evercore in partnership with HEC Paris¹ that appears to further the conclusions of the prior two. As we identified in the abovementioned report, these data continue to illustrate that CVs inherently show less return volatility. This is demonstrated by the comparison of CV vintage year performance to a representative basket of buyout funds.
1. Evercore Private Capital Advisory – Q2 2025 Continuation Fund Performance Report, October 2025.
Performance Metrics (TVPI & Norm. Gini) by Fund Type
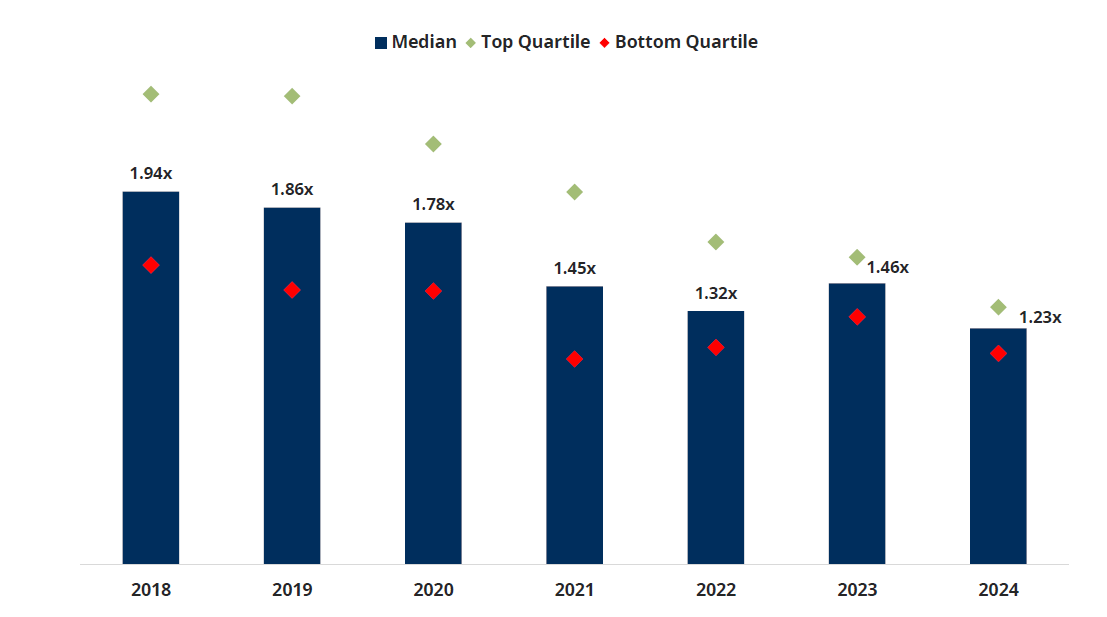
A second conclusion that is also solidified by the updated figures is the notion that CV performance on a vintage year basis also shows strong performance relative to other Private Equity opportunities, and particularly, those transactions achieving top quartile results. As we identified in our previously released article, we believe the distinction between top quartile and median performance demonstrates the importance of asset selection in this market.
CVs TVPI by Vintage (Top Quartile, Median & Bottom Quartile)
While these are positive trends for the CV market, it’s important to identify that the dataset is still largely unrealized, and thus many of the performance figures rely on valuation estimates as opposed to market determined prices. While not a cause for concern, it does raise the question as to both the validity of the unrealized valuations as well as the potential upside or downside that we may see when the exits finally occur.
We have historically tracked the uplift achieved at realization across our portfolio, and our data tells us that there is typically some form of valuation uplift at exit relative to holding values 12 months prior. Over a long 10-year average period, this uplift² has trended in the range of 40-50%. It’s worth noting more recently however that this figure has compressed given today’s valuation environment. To what extent these valuation dynamics could be applicable to CVs, however, remains an interesting question.
2. AltamarCAM internal data. Company Gross TVPI at exit vs. 1 year prior to exit announcement. Primaries and Co-Investments (Private Equity Buyouts). All geographic areas. Excludes IPOs. Analysis in investment currency. Valuation as of September 30th, 2025. The database is constantly updated; hence,historical values may vary slightly from previous filings. AltamarCAM funds: ACP PE 1, ACP PE 2, ACP PE 3, ACP PE 4, ACP PE 5, ACP PE 6, & ACP PE 7. Note: Past returns are not necessarily indicative of future results given that the current economic conditions are not comparable to prior conditions, which may not repeat in the future. There are no guarantees that the funds will have similar results as previous funds.
In our view, while there are some parallels, there are other factors that might suggest a deviation from more traditional outcomes (deal dynamics, market testing, etc.), and thus we believe that CVs are more likely to exhibit a more market-tested valuation prior to exit. It however will be fascinating to track these results in 2026 as many of the initial CV boom-era transactions are expected to seek exits.
What continues to hold as we constantly evaluate this market is the extent to which it seems poised only to grow. In a recent report, Jefferies speculates the CV market could more than double by 2030 and they estimate that CVs could represent up to 20% of global sponsor-backed exit volume, up from approximately 14% in 2025.³ In part, what’s driving this growth is the broad acknowledgement that CVs often contain high conviction, desirable assets that can generate attractive outcomes even in more difficult exit environments.
2026 should be a telling year for the CV market, and we will be sure to issue an update when a clearer view emerges.
3. Jefferies State of the GP-Led Secondaries Market, February 2026

cloud technology axon
This transaction reinforces Alantra’s continued momentum in Aerospac...