A common question from the investor community is how movements in the public markets affect buyout valuations. Some investors may even question whether valuations in buyout funds are fair, especially in times of market and macro-economic instability like this one. Further scrutiny comes from the fact that we are currently seeing the largest stock of companies in the private markets in history. What is our perspective on the matter? There are several factors that justify a smoother buyout valuation evolution compared to stock markets, and the reasonable valuation practices of many buyout firms.
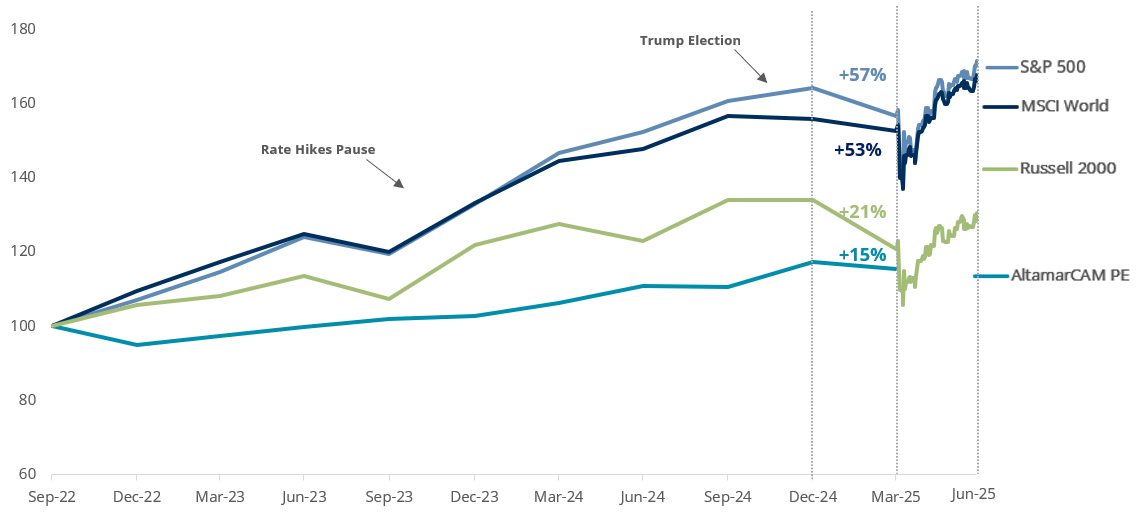
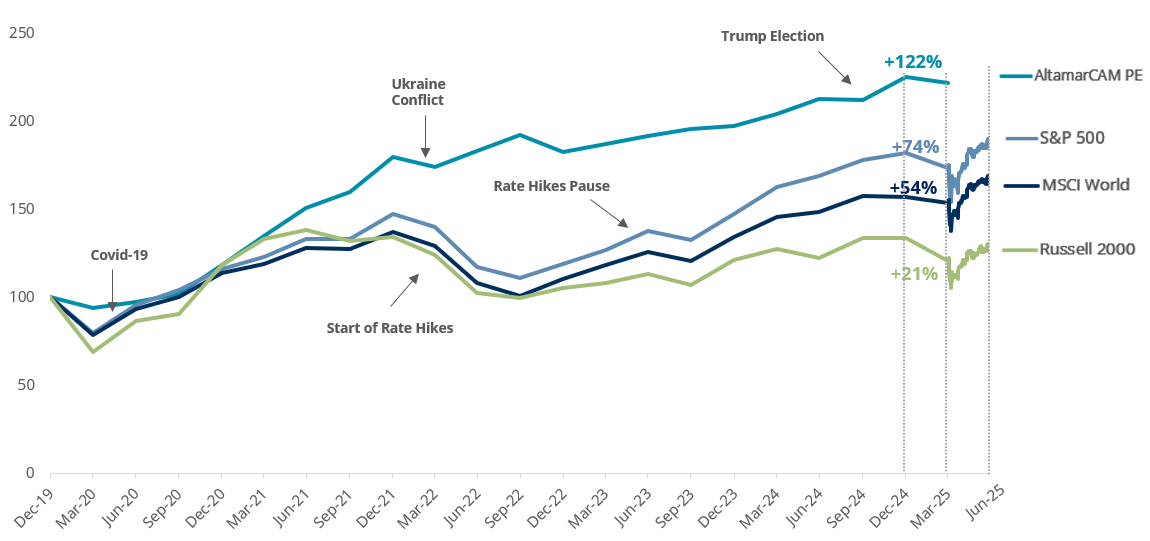
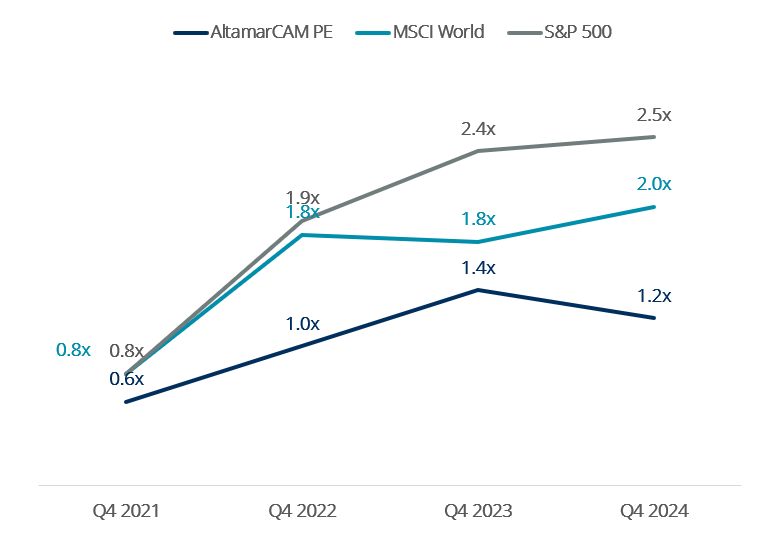
A first top-down approach to valuation evolution reveals that private equity buyout strategies are set for long-term performance. Valuation movements tend to be smoother than those observed in the stock markets, both in upward and downward directions. We cannot hide that stock markets have experienced a strong rally since 2022 bottom, but we can observe that when benchmarked against private equity buyouts since end 2019 (pre-covid), AltamarCAM buyout portfolio performance has been higher than the one in the main public equity indices. Regardless of the time frame considered, it is important to note that valuation fluctuations are smoother in the buyout asset class than in public equity markets as shown in the following charts below:
AltamarCAM PE Portfolio1 vs Listed Indices Quarterly Evolution (3Q 22 to 1Q 25)
AltamarCAM PE Portfolio vs Listed Indices Quarterly Evolution1 (4Q 19 to 1Q 25)
There are several facts supporting this, highlighting four key aspects which are supported by some market and AltamarCAM’s private equity portfolio data:
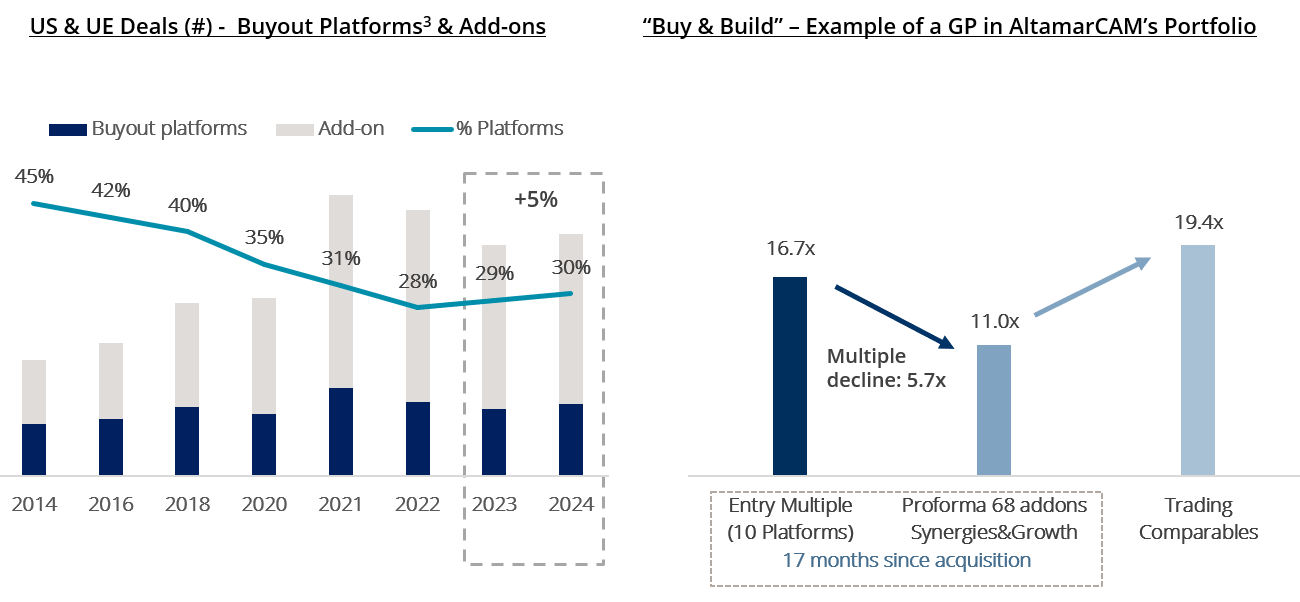
Entry Multiple2 Evolution of AltamarCAM PE Portfolio vs Stock Market (EV/EBITDA LTM Median)
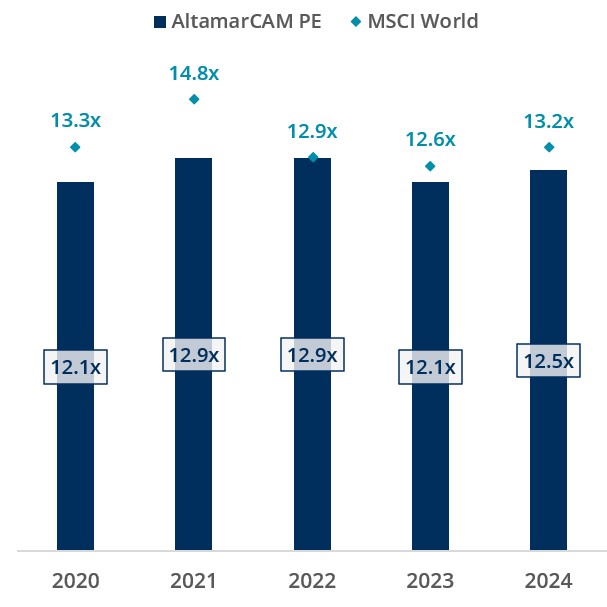
Additionally, the buyout industry has seen increasing activity over the years in buy and build, allowing for a blend down of entry multiples as these are done at accretive multiples not reflected in the market statistics.
Valuation Evolution2 of AltamarCAM PE Portfolio vs. Stock Market (PEG Ratio)
Why such an outcome? Buyout companies are typically smaller, with a higher potential for growth. The sector mix is different, as buyout firms tend to focus their sourcing on long-term secular growth themes. This leads to growing subsectors and business models with several features that increase resiliency in portfolios, as they are characterized by having several of the following features (among others):
Sector Mix3 & Enterprise Value or “EV” ($b) of AltamarCAM PE Portfolio vs Public Markets
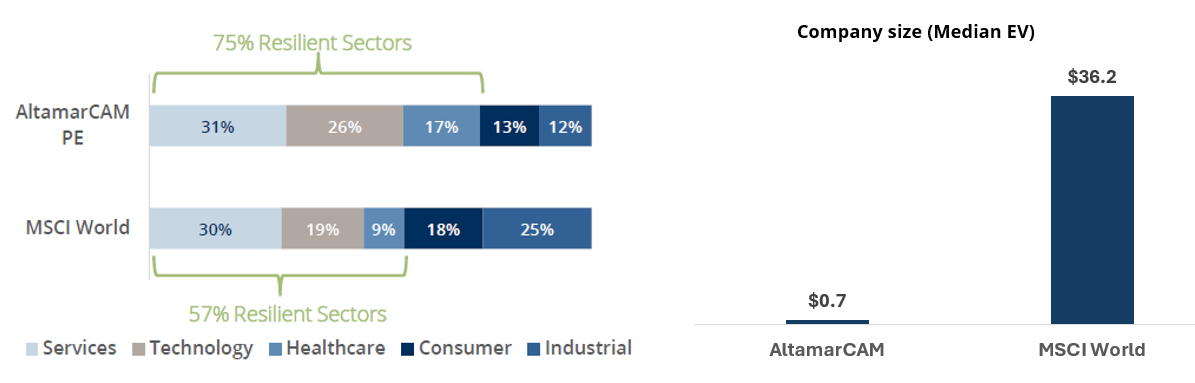
All these tend to translate into businesses with attractive cash flow generation, healthy margins, pricing power, but most importantly, growth (both organic and inorganic, as stated before).
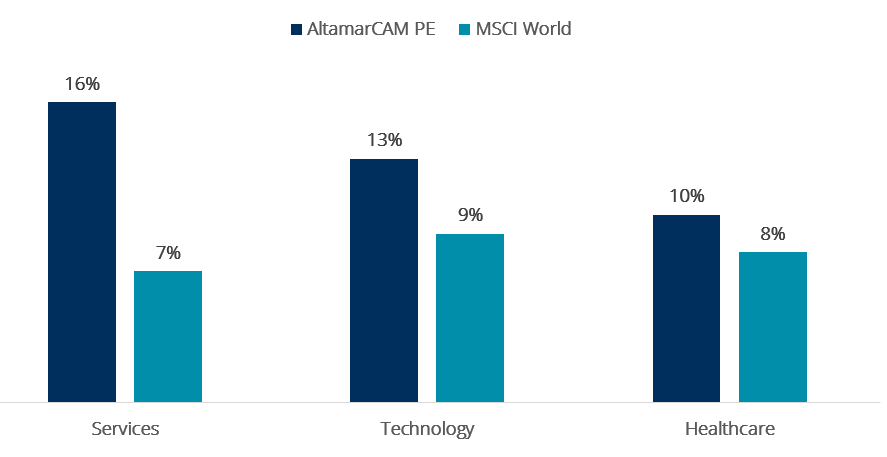
LTM EBITDA4 Growth Evolution (Median, % YoY)

EBITDA4 Growth of Top Sectors (AltamarCAM PE Portfolio vs Stock Market; Q4 19 – Q4 24 CAGR)
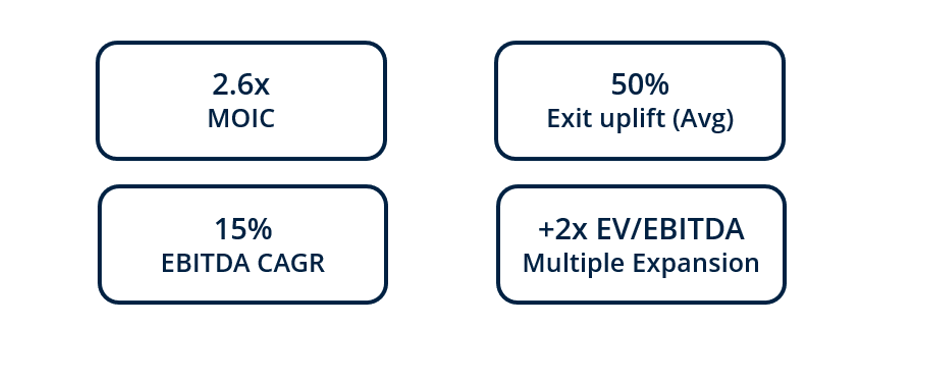
AltamarCAM PE Exits5 (+500 exits in 2019-24 Period)
When observing AltamarCAM’s buyout portfolio, we come to several conclusions:
All the discussed factors support a smoother buyout valuation evolution against stock markets, and a reasonable valuation methodology applied by buyout firms.
Given these dynamics, it is essential for investors (LPs) to partner with managers that know how to apply value creation measures to influence EBITDA increase, acting on revenues, margins and cash flow optimization to support growth, as well as be tactically smart to source and exit deals.
Footnotes:
1. Sources: AltamarCAM PE Portfolio measured as evolution of the residual value (NAV) of underlying companies between periods, including the effect of distributions and neutralizing the effect of capital calls between periods. AltamarCAM funds: ACP PE 1, ACP PE 2, ACP PE 3, ACP PE 4, ACP PE 5, ACP PE 6, ACP PE 7, ACPS 1, ACPS 2, ACPS 3, ACPS 4 & ACPS 5. Stock Market Evolution from Investing.com. All stock indices include 0.25% annual fee. For the period 4Q 19 to 4Q 24, the quarterly evolution of the public indexes has been informed, while for the period April 1, 2025 to June 30, 2025, the daily evolution has been informed.
2. Source: AltamarCAM internal data (+1,100 companies). The sample includes AltamarCAM PE primaries, secondaries (from 2020 onwards) and co-Investments in North America and Europe. The sample excludes credit investments & other (<1% of the total). MSCI World EV/EBITDA median has been calculated as the median multiple of all the quarters of the year. Portfolio data includes AltamarCAM FoFs: ACP PE 3, ACP PE 4, ACP PE 5, ACP PE 6, ACP PE 6 MM, ACP PE 7, ACP PE 7 LMM, ACPS 2, ACPS 3, ACP S4, ACPS 5, and ACP PE Co-Investments.
3. Data obtained from: Q1 2025 European PE Breakdown & Q1 2025 US PE Breakdown Report. Deal Value for the US and Europe have been aggregated. The exchange rate at the end of each year has been used to convert dollar amounts to euros. The number of transactions for the US and Europe were also aggregated. Data for buyout platforms and add-ons. PE Growth/Expansion category was excluded from the sample. The database is constantly updated; hence, historical values may vary slightly from previous filings.
4. Source: AltamarCAM internal data (+1,100 companies). The sample includes AltamarCAM PE primaries, secondaries (from 2020 onwards) and co-Investments in North America and Europe. The sample excludes credit investments & other (<1% of the total). MSCI World EV/EBITDA median has been calculated as the median multiple of all the quarters of the year. Portfolio data includes AltamarCAM FoFs: ACP PE 3, ACP PE 4, ACP PE 5, ACP PE 6, ACP PE 6 MM, ACP PE 7, ACP PE 7 LMM, ACPS 2, ACPS 3, ACP S4, ACPS 5, and ACP PE Co-Investments.
5. Source: AltamarCAM internal data (+1,100 companies). The sample includes AltamarCAM PE primaries, secondaries (from 2020 onwards) and co-Investments in North America and Europe. The sample excludes credit investments & other (<1% of the total). MSCI World EV/EBITDA median has been calculated as the median multiple of all the quarters of the year. Portfolio data includes AltamarCAM FoFs: ACP PE 3, ACP PE 4, ACP PE 5, ACP PE 6, ACP PE 6 MM, ACP PE 7, ACP PE 7 LMM, ACPS 2, ACPS 3, ACP S4, ACPS 5, and ACP PE Co-Investments. +500 companies exited during the 2019-2024 period, delivering 2.6x Gross MOIC (primaries and co-investments). Exit uplift data excludes IPOs.

cloud technology axon
This transaction reinforces Alantra’s continued momentum in Aerospac...